What is alternative text? How do I write it for images, charts, and graphs?
Presented on 19 May 2022 to the University of Southampton Office 365 Community.
Presentation recording and transcript
Synopsis
What do we mean by alternative text? Who is it useful for? What strategies can we use for writing it? How might we write alternative text for more complex images like graphs, flow charts, and venn diagrams? I attempt to explain in this video. It was recorded live as a webinar for the University of Southampton's Office 365 Community. I've included the questions and answers from the session.
Materials
Example images used during the presentation
- Southampton Theory Astrophysics and Gravity (STAG) Research Centre: Intense wind found in the neighbourhood of a black hole.
- Southampton's Bargate.
- Shot of two unrecognizable businesspeople shaking hands stock photo.
- Process of photosynthesis.
- Beating blindness: Using cutting-edge technologies to develop better treatments for eye conditions.
- Stockman and Sharpe (2000) 2° cone fundamentals, plotted against sRGB spectrum.
- The Biopsychosocial model of health.
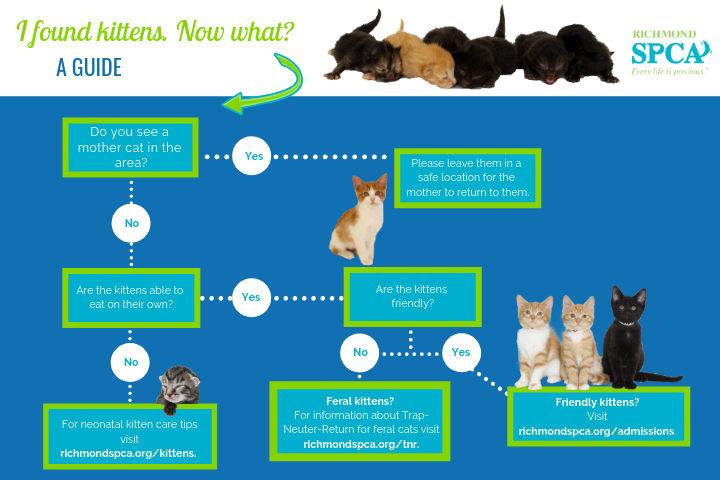
- I found kittens, now what?
Links to further resources
- Penn State University: Documentation Screen Captures.
- textBox Digital : The focus|LOCUS method.
- Diagram Center: How to describe complex images.
- POET Training Tool.
- Check accessibility as you work in Microsoft Office
- Diagram Centre: Image Description Guidelines
- NWEA Image Description Guidelines for Assessments [PDF]
- Workshop Materials: Introduction to Alternative Text